Insana Lab: Ultrasonic Imaging - The University of Illinois at Urbana-Champaign
Insana Lab: Ultrasound Research Interface (URI)
Program List
Here you will find the Matlab scripts and functions included in the URI-OPT package.
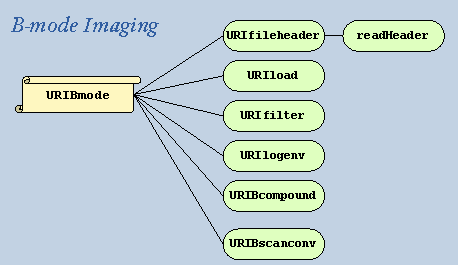
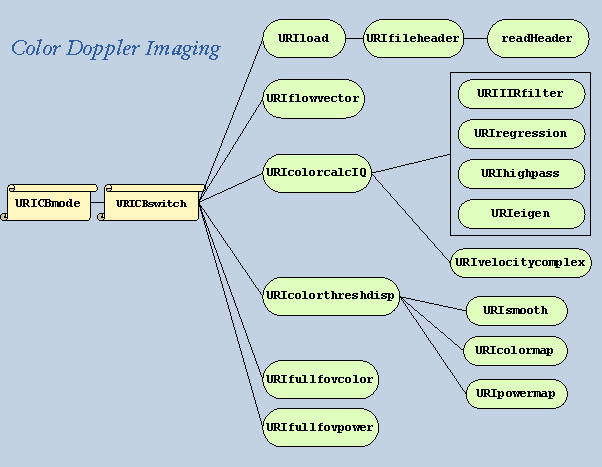
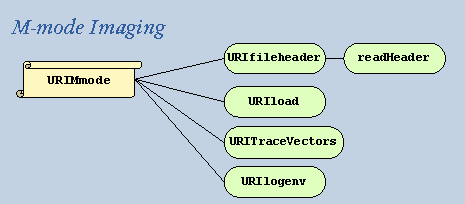
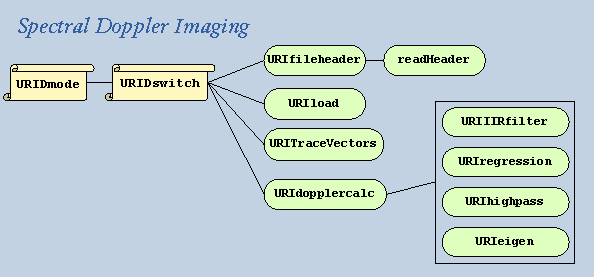
The tree diagrams below illustrate how each program is linked with others in different imaging modes.
Click on the nodes in the following tree diagrams to see explanation of each Matlab program.
readHeader.m
This and a collection of Matlab functions in URI Header Reader (copyright Siemens) load various header parameters into variables.
top
URIBCompound.m
This is a Matlab function to spatially blend (compound) multiple B envelop vectors acquired at the same lateral postion into a single vector.
top
URIBmode.m
This is a Matlab script to prompt user for inputs and begin processing B-mode image.
top
URIBscanconv.m
This is a Matlab function to automatically scan convert and display the grayscale B-mode image based on beam geometries in the file header.
top
URICBmode.m
This is a Matlab script to generate graphical-user-interface for inputing color flow processing parameters.
top
URICBswitch.m
This is a Matlab script linked with URICBmode.m for color flow processing.
top
URIcolorcalcIQ.m
This is a Matlab function to down-convert RF data into I/Q data.
It then calls the filter function based on user inputs.
The axial velocity and power are then calculated.
top
URIcolormap.m
This is a Matlab function to overlay flow intensity on background B-mode image, and generate the colormap for flow display.
top
URIcolorthreshdisp.m
This is a Matlab function to apply thresholds to the velocity and power estimation based on user inputs.
It then displays the images by calling corresponding Matlab functions.
top
URIDmode.m
This is a Matlab script to display the spectral doppler image from an URI RF data file acquired in D or DB mode with a graphical userer interface.
It also has the option to process and display color M-mode instead of spectral Doppler.
top
URIdopplercalc.m
This is a Matlab function to calculate the Doppler spectrum of the input data.
top
URIDswitch.m
This is a Matlab script linked with URIDmode.m for spectral Doppler processing.
top
URIeigen.m
This is a Matlab function to apply eigen filter based on user input parameters.
top
URIfileheader.m
This is a Matlab function to load file header from file into variables.
top
URIfilter.m
This is a Matlab function to apply FIR or IIR low/band/high filter based on user inputs.
top
URIflowvector.m
This is a Matlab function to convert 2D RF data matrix into a 3D matrix suitable for color flow processing.
top
URIfullfovcolor.m
This is a Matlab function to display scan-converted region-of-interest color flow intensity on full field-of-view background B-mode image.
top
URIfullfovpower.m
This is a Matlab function to display scan-converted region-of-interest power intensity on full field-of-view background B-mode image.
top
URIhighpass.m
This allows user to select Matlab's internal high-pass filters functions (Butterworth, Chebychev, or FIR) based on input parameters.
top
URIIIRfilter.m
This is a Matlab function to apply projection-initialized IIR (infinite impulse response) Butterworth filter based on user input parameters.
top
URIload.m
This is a Matlab function to load RF data from file into variable.
top
URIlogenv.m
This is a Matlab function to log-compress and envelop the input 2D RF data.
top
URIMmode.m
This is a Matlab script to display the M-mode image from an URI RF data file acquired in M-only mode (not M-live/B-live).
top
URIpowermap.m
This is a Matlab function to overlay power intensity on background B-mode image, and generate the colormap for power display.
top
URIregression.m
This is a Matlab function to apply regression filter based on user input parameters.
top
URIsmooth.m
This is a Matlab function to apply 2D spatial smoothing to the velocity and power displays.
top
URITraceVectors.m
This is a Matlab function to extract D or M vectors from B-live/D-live or B-live/M-live data.
top
URIvelocitycomplex.m
This is a Matlab function to calculate flow velocity based on autocorrelation phase shift.
top
