


Insana Lab: Ultrasonic Imaging - The University of Illinois at Urbana-Champaign
Insana Lab: Ultrasound Research Interface (URI)
Tutorials | B-Mode | 2D Color Doppler | More Color Doppler | Scan Conversion | M-mode | Spectral Doppler | Misc. FunctionsM-Mode
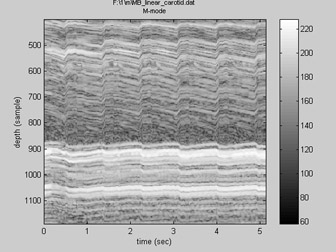
M-mode displays the echo intensity along a single axial line as a function of time.
The URI-OPT M-mode display currently only supports RF data collected in the URI M-only and B-live/M-live modes.
The current version of program takes a long time to process a large M-mode file (>40MB), and may run into memory overflow problem.
In Matlab:
>> URIMmode
User will be first prompted to select an URI RF data file.
Depending on the acquired URI data (M-only or B-Liv/M-liv), one of these following prompt windows will pop up:
(Move cursor over the fields in these pictures to see short descriptions)
for M-only acquisitioins: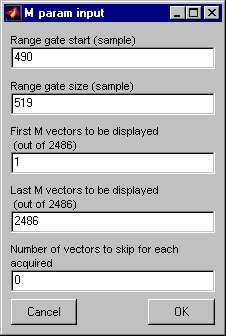
|
for BM acquisitions: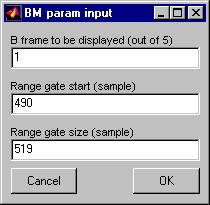 (For BM data, while only a single frame of B-mode image can be selected, all available M vectors will be automatically used for the M-mode display.) |
Press "OK" to start processing.
When process is finished, the log-compressed envelop of the M-mode data will be displayed against time:
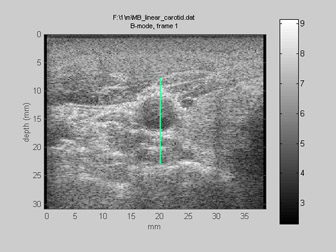
If the loaded URI data is acquired under B-Liv/M-liv combined modes,
then a separate figure will display the B-mode image (automatically scan-converted, if necessary) with indicator of the range gate location.
| For more information, please also look at the function URIMmodeF.m on how M-mode is processed in URI-OPT. URIMmodeF.m is the functional form of URIMmode.m. It does not use graphical-user-interface, but is convenient for user to modify and test out new codes. |
