


Insana Lab: Ultrasonic Imaging - The University of Illinois at Urbana-Champaign
Insana Lab: Ultrasound Research Interface (URI)
Tutorials | B-Mode | 2D Color Doppler | More Color Doppler | Scan Conversion | M-mode | Spectral Doppler | Misc. Functions2-D Color Doppler
Ultrasonic Color Doppler (C-mode) is a 2D image with non-zero velocities represented by colors mapped onto B-mode images.
To run this 2D color Doppler program in Matlab:
>> URICBmode
You should see a window similar to this:
or click on them to see full explanations.)
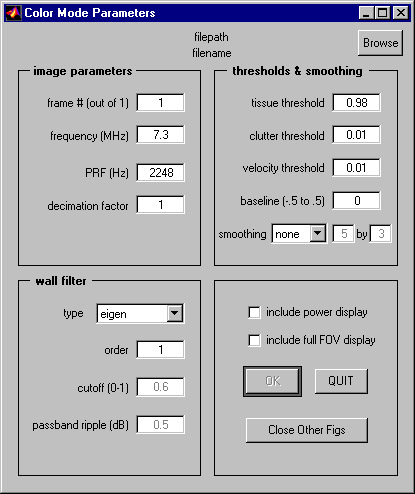
Select an URI data file by pressing the "Browse" button at the upper right corner.
(If the informations are available in the file's header, then the corresponding "frequency" and "PRF" fields will be automatically updated on the GUI window.)
Now you can manually adjust the parameters in all fields.
You may also check the "include power display" box if you wish to generate a separate power Doppler image with the same data.
The "include full FOV display" box is checked if you wish to overlay the color flow ROI onto the full FOV broadband B-mode image. This may take a little more processing time, depending on the computer used.
Finally, press "OK" button. The Matlab command window will display this message:
Processing......
Do not click on the GUI window while Matlab is processing, or images may be displayed incorrectly.
When Matlab has finished processing a single frame, a new figure with the image will pop up, and the following message will be displayed in the command window:
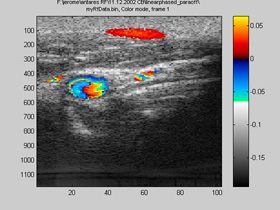 |
done elapsed_time = xx.xxxx |
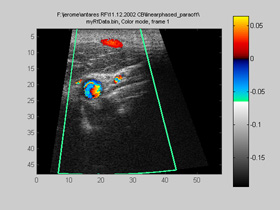
If the "include full FOV display" box has also been checked, a second figure would have been displayed.
This figure is generated using the beam geometry in file header and the broadband B-mode RF data available in the URI data file.
This image should be very similar to what was displayed on the Antares system.
Try changing the parameters in the GUI and then reprocessing to see the effects on the images.
When the processing is done, there will be some variables available in the Matlab workspace.
Some of these variables can be used by users for further analysis:
(Note: These are case-sensitive, unlike most of the Matlab functions.)
|
FileHeader: file header structure which contains information about the echo data. FlowVectorArray: double precision 3D matrix of RF data. NarrowBandBmode: double precision 2D matrix of log-compressed envelop of narrowband echo data in the region of interest. PowerPostFilt: double precision 2D matrix of power amplitude of echo data after wall filtering. PowerPostThresh: double precision 2D matrix of power amplitude of echo data after wall filtering and thresholding. PowerPreFilt: double precision 2D matrix of power amplitude of echo data before wall filtering. VAxial: double precision 2D matrix of axial velocity estimates in the region of interest. VAxialFilt: double precision 2D matrix of axial velocity estimates in the region of interest after wall filtering and thresholding. UserInput: structure containing the parameters entered by user. VectorArray: structure containing VectorArray.RfData and VectorArray.Header. VectorArray.RfData is 16-bit integer 2D matrix of RF data. VectorArray.Header is unsigned 8-bit integer 2D matrix of vector header. |
| For more information, please also look at the function URICBmodeF.m on how color mode is processed in URI-OPT. URICBmodeF.m is the functional form of URICBmode.m. It does not use graphical-user-interface, but is convenient for user to modify and test out new codes. |
Note: Both the URI software and the Offline Processing Tools are still under development. Parameters of the programs are subject to change.
Parameters and Buttons in the Color Doppler GUI
File PathThe path name of the RF data file being processed.
top
File Name
The filename of the RF data file being processed.
top
Browse Button
Press this button to select other RF data files.
top
Frame Number
Select a single frame from the RF data file. The total avaible number of frames is displayed in parenthesis.
top
Center Frequency
The center carrier frequency of the RF data, in MHz.
If not automatically loaded from file header, please enter corresponding nominal center frequency displayed on the Antares system screen at the time of acquisition.
top
Pulse Repetition Frequency
The repetition frequency between pulses used for color mode acquisition, in Hz.
If not automatically loaded from file header, please enter corresponding PRF displayed on the Antares system screen at the time of acquisition.
top
Decimation Factor
Decimation factor is used after RF has been down-converted to I/Q.
The higher decimation factor may speed up processing, at the cost of spatial resolution.
DecimationFactor > 1: decimation
DecimationFactor < 1: interpolation
DecimationFactor = 1: no decimation, but I/Q is still generated and used
DecimationFactor = 0: For testing purpose only. RF instead of I/Q is wall-filtered. This may not give accurate estimates.
top
Ensemble Size
This field is blank at first, but appears after a file has been selected with the "Browse" button.
It shows the ensemble size (beam repetitions at each location) used for the flow data.
top
Wall Filter Type
Select the type of wall filter to be used.
Available options: no filter, IIR, regression, RMS butterworth, RMS chebyshev, eigen.
top
Wall Filter Order
The order of the wall filter.
top
Filter Frequency Cutoff
The cutoff frequency for IIR, RMS butterworth, or RMS chebyshev filters.
This value is a fraction of the center frequency.
This number times the center frequency in MHz give the cutoff frequency in MHz.
This parameter is not used for regression or eigen filters.
top
Chebyshev Filter Passband Ripple
The passband ripple for RMS Chebyshev filter.
top
Tissue Threshold
Stationary tissue often has higher intensity than flowing blood, so the objects with higher pre-wallfiltered signal amplitude in the image usually suggests stationary tissue.
Increasing tissue threshold allows fewer samples to be mapped with color; decreasing tissue threshold allows more samples to be colormapped.
Enter 0 to skip this step.
top
Clutter Threshold
The power of each post-wallfiltered samples has to exceed ClutterThreshold to be designated as non-stationary and non-noise.
It is similar but opposite to "gain" in the color mode on an ultrasound system. Increasing clutter filter, similar to decreasing gain, will decrease the amount of colormapped flow.
Enter 0 to skip this step.
top
Velocity Threshold
Velocity estimation has to exceed this threshold to be colormapped.
Increase velocity threshold to decrease amount of colormapped velocity.
Enter 0 to skip this step.
top
Baseline
Adjusting the zero-velocity baseline of the colormap between -50% and 50% to avoid aliasing. Default is 0.
top
Smoothing Gate
Smoothing methods used for color flow display: none, 2D median filter, weighted spatial 2D averaging.
Select smoothing window size in samples: axial depth by lateral width.
top
Power Display checkbox
Check to display a seperate power doppler image along with the color image.
top
Display Full FOV checkbox
When this box is checked, upon pressing "OK" button, an extra figure will display the color flow ROI mapped onto the full FOV broadband B-mode background.
Note: The algorithm uses beam geometry in the fileheader of the URI data file. This algorithm will not work if data is acquired with a different source other than URI.
top
OK button
Start processing with the input parameters.
Do not press repeatedly.
top
Quit button
Close GUI and clear figure handles.
top
Close Other Figs button
Close all other Matlab figures except this GUI. It does not affect the variables in workspace.
top
